Optimise battery usage of Android Applications
Pawel Krawczyk · September 18, 2023 · 8 min read
The Current Problem
How often do you see people in public space desperately seeking for a plug to avoid smartphone going flat? Especially during travels, our device is essential and the vision of losing it, is almost like becoming blind. In such time we are wondering how it is even possible that our brand new, top shelf phone cannot endure even one the full day without charging. And this is a moment, when most of the people start to look for a culprit by checking the battery usage statistics in the system settings. The last thing that you want is that user will find out your application on the top of the guilty list and uninstall it. In this article you will find out how to assess and reduce your application battery usage.
The Battery Historian tool
The Android system settings presents the application battery usage as percentage, but does not provide many details, apart from time spent in foreground and background. There are numerous factors that have influence on the energy consumption like utilising sensors, animations, wake locks, mobile radio scanning, CPU usage to name a few. But how to check when your application is using such services?
Google’s Android developer website comes with a handy solution for profiling the battery usage with Battery Stats and Battery Historian. Those tools allow to inspect battery-consumption patterns via Android Debug Bridge (adb) and visualise on the HTML graphs, to analyse the output on your browser. The Battery Historian chart graphs power-relevant events over time with clear partition to the categories of usage mentioned above. It also allows users to compare bug reports side by side, showing changes in critical parameters. The installation and first steps are described here.
Testing
Once Battery stats and Battery Historian is installed on your PC, start testing with resetting battery data gathering via adb:
adb shell dumpsys batterystats --reset
Then open your application and start to use it with all available flows and with all permissions enabled (especially sensors, if available). After covering half of the application features, switch to other applications, to put the tested one in the background, and use your device as usual for several minutes. Your application will change state to the “App Standby”. Then turn your screen off and don’t use it for some time, to allow the device to enter “Doze” mode. You can experiment with having the device stationary or moving to allow it to enter the lightweight versions of the Doze mode. Finish the tests by opening your application again and testing the rest of the features. Once you are done, connect the phone to your PC and download data according to this instruction.
How to interpret the results
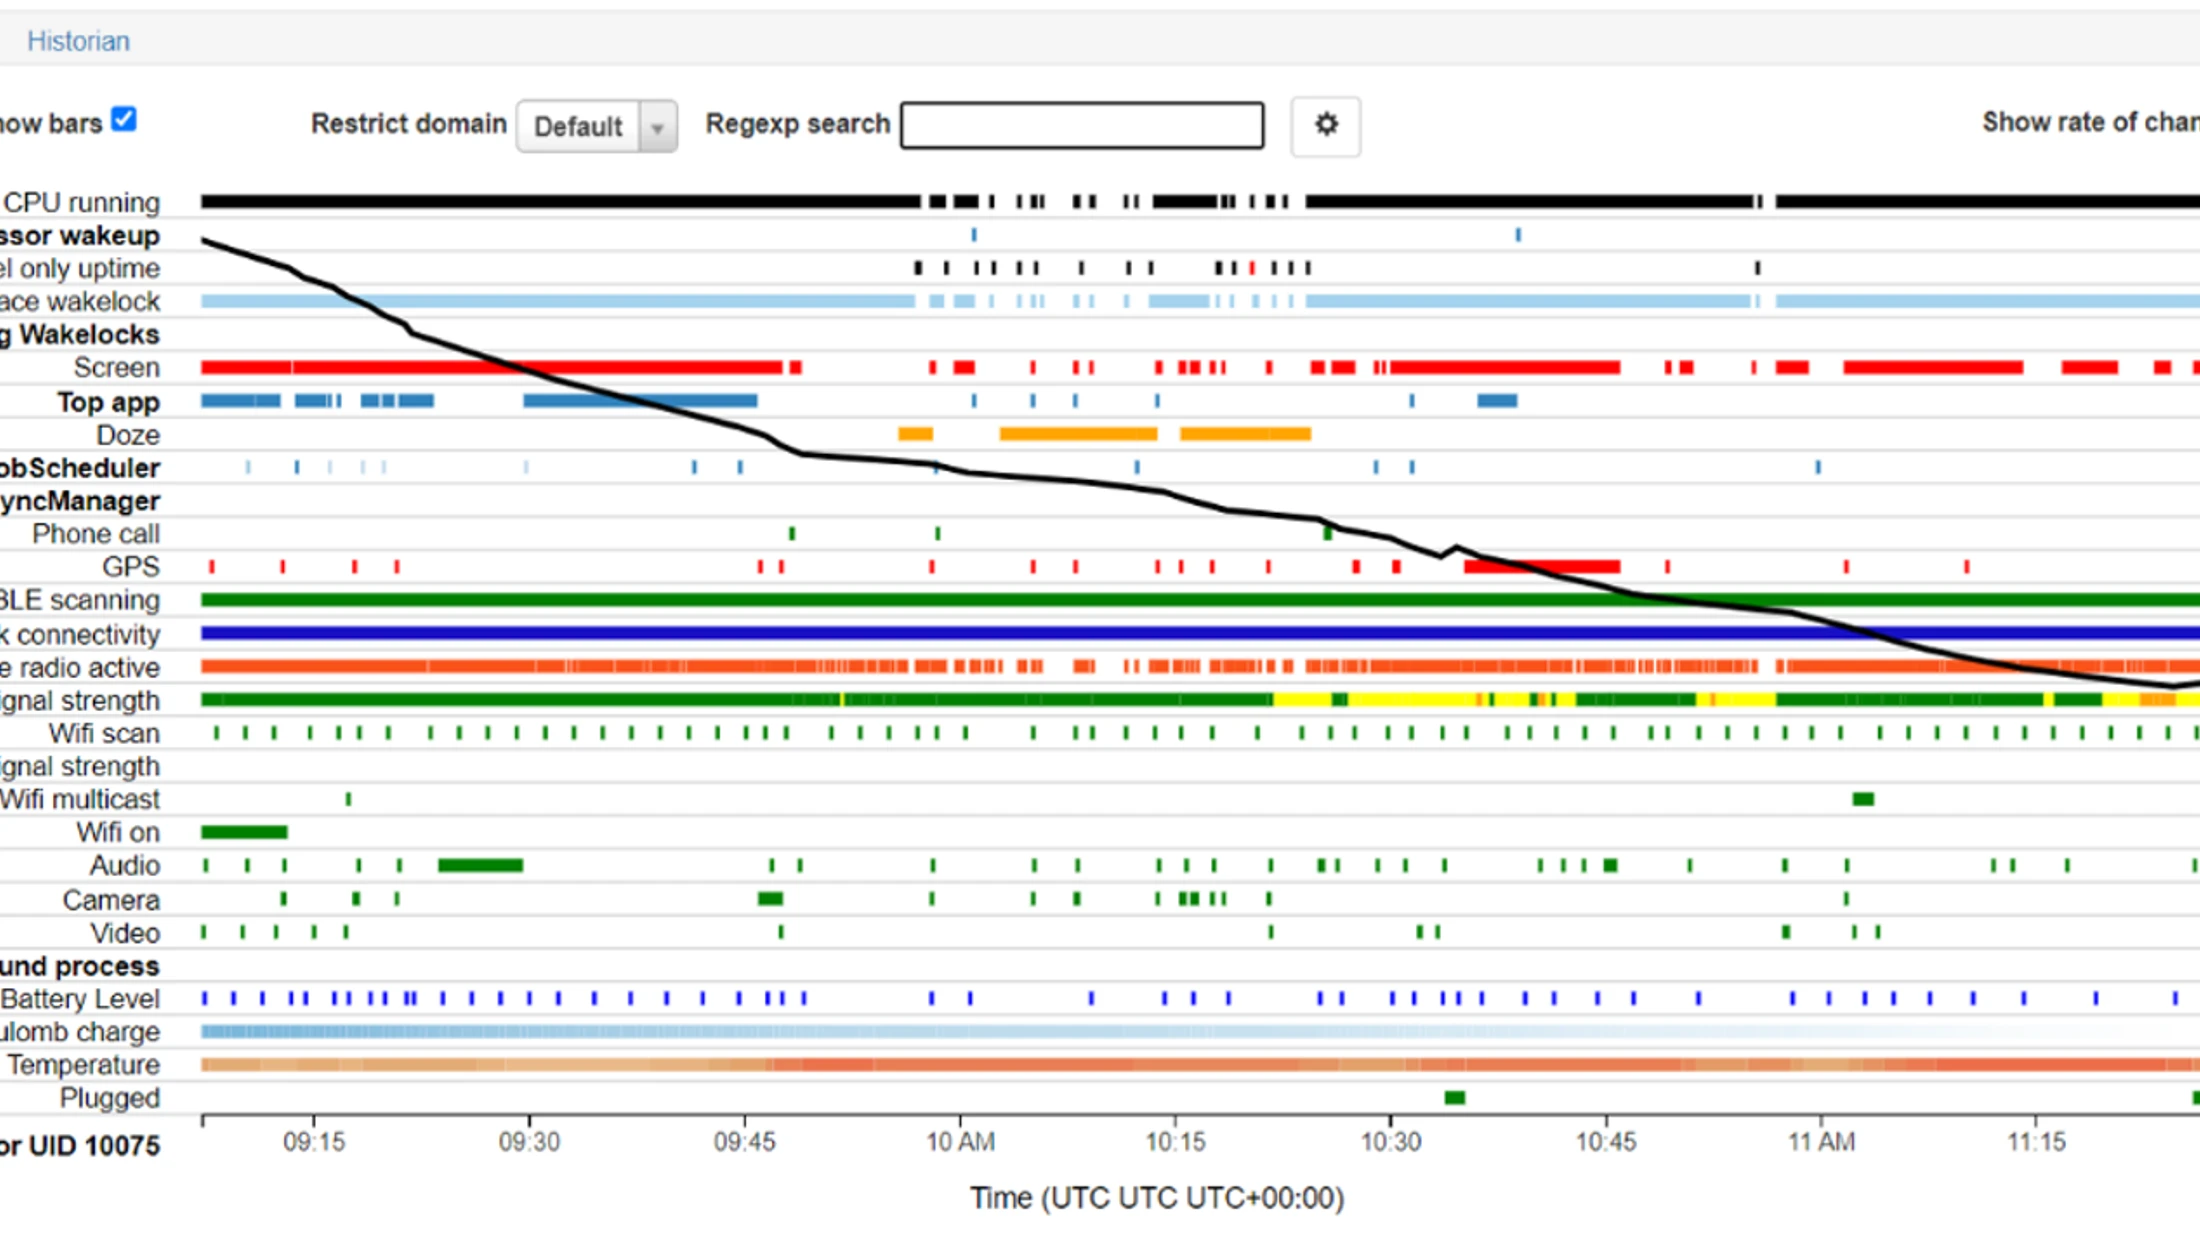
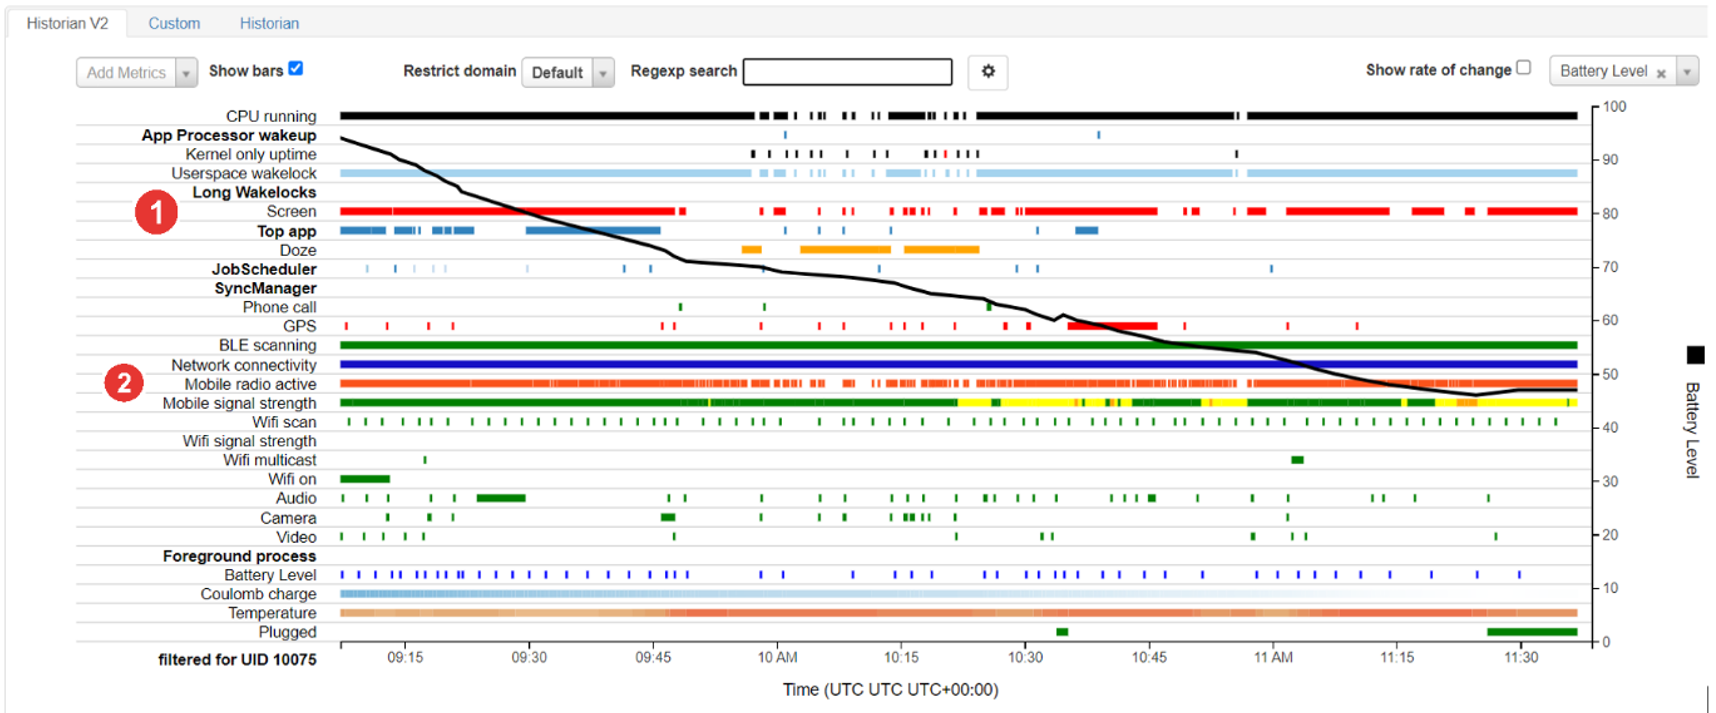
The next step is to analyse the test results. For the AutoScout24 application, the testing session lasted for almost 2.5 hours according to instructions above and almost all the features were covered. The battery drainage is presented on the graph below with oblique black line:

Figure 1 - General Report from Battery Historian
The battery historian tool is interactive, and user can hover the rows for more details in multiple categories. The fastest battery drainage occurs when the screen (1) and the mobile radio (2) is active. The amount of data can be overwhelming, but luckily there is a regular expression search feature, which can be used to filter out events connected with particular application:

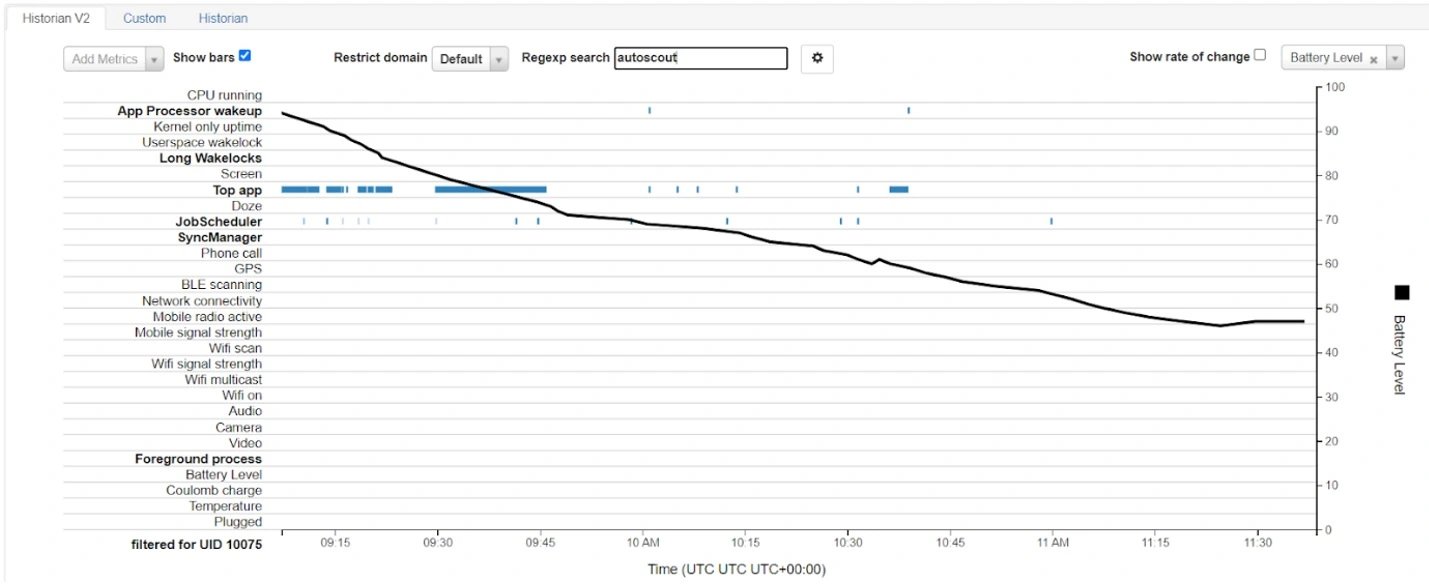
Figure 2 - Report from Battery Historian – filtering for AutoScout24 app
Now we can clearly see, when the AutoScout24 application was actively used, when it woke up the processor and how many background jobs were performed. The Job Scheduler was started over a dozen times and Sync Manager was not used. All Job Scheduler calls were done by “SystemJobService”. It shows that AutoScout24 application is using WorkManager as the component responsible for managing worker execution, which is a recommended practice. The next interesting statistics can be found in “Device’s Power Estimates” tab:
Figure 3 – Device’s power estimates
It shows that the screen was responsible for most of the battery drainage. AutoScout24 had a bigger impact on the battery than WhatsApp and Instagram, but they were used only for a couple of minutes compared to a full hour. Therefore, the battery usage of the AutoScout24 application is healthy. The Battery historian have so many features, that it will be hard to cover it in short article, so the “App selection” view will be the last one presented:

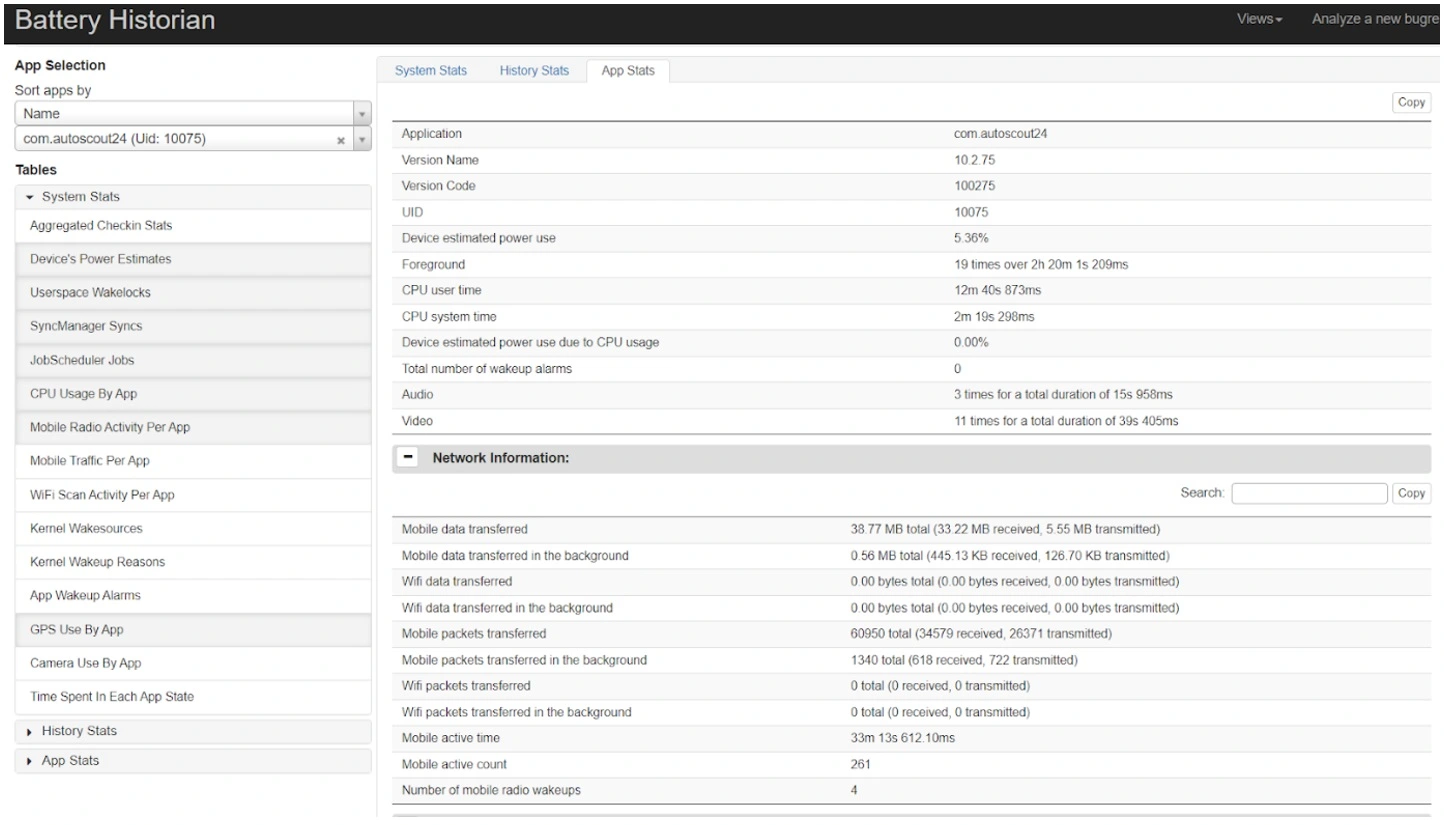
Figure 4 – Battery Historian – application statistics tab
It provides data about the network, CPU, GPS usage, user space wake locks and more. It shows that the application does not use alarms and it uses audio and video for a couple of seconds to display advertisements. It also shows that the application heavily relies on the mobile data connection and performed four radio wakeups to restore the internet connection.
The result of the analysis is that AutoScout24 application is not using features that have significant impact on the battery life:
• No direct usage of sensors, Bluetooth, sockets or other technologies keeping long connections • No usage of AlarmManager, WakeLocks and foreground services • Using only Job Scheduler with the system’s Work Manager • Not using broadcast receivers, which are waking the application frequently like CONNECTIVITY_CHANGE or NEW_PICTURE • Not a lot of animations, sounds or videos (excluding advertisement)
Investigation shows that there are no major issues or quick wins, but there is always a question: what can be improved? As application heavily rely on the internet connection, in the next section we will focus on improving in this area.
Ways to improve
Networking is one of the biggest battery hog. Reduce the number and size of the network calls to the greatest extent possible. It can be achieved by optimising the frequency of network requests by batching requests, to stop device from waking up every second. Use WorkManager API to easily plan deferrable asynchronous tasks. Never poll the server for updates. Pinging every 20 seconds, keeps the radio powered on indefinitely. Instead, use a service such as Firebase Cloud Messaging, which allows the server to let your app know when new data is available. Synchronise data only as often as you must, ideally when the device is on Wi-Fi and plugged in. See more how to modify your download patterns based on connection type here.
Reducing size of data per request is possible by optimising the images and media files size by choosing compressed formats, using compact data models and downloading only the necessary records. Do not fetch the whole collection of data, but only the part visible for the user. To further improve, you can separately get text and “lazy” load the pictures. Cancel the image download, if the user scrolls past the item. AutoScout24 uses GraphQL to reduce over-fetching and minimize round trips.
Screen was the second most important factor for battery drainage in AutoScout24 application. Since 2017, a majority of the smartphones that were launched in the market have an OLED screen. According to the research at Purdue University, at 100% brightness levels, users could see savings between 39%-47% of battery power with Dark Mode enabled, so it is really important to implement it for your application. At AutoScout24 we are always supporting it and the new preview tools in Jetpack Compose are making it easier than ever.
The next concern was that AutoScout24 is using energy-consuming GPS to display the map of cars available nearby. The best advice here is to use the last known location or request passive location updates if applicable and avoid using the GPS sensor altogether. If you must use the GPS, determine whether coarse location is enough and unregister your location listener, after coordinates have been received. Also, using FusedLocationProvideApi is a good idea as it is more efficient. The rule for most sensors is fairly straightforward, turn them off as soon as you have the data that you need. If you use a sensor and you can work off the cached data in the future, do so.
Conclusion
Battery historian is an excellent tool and allows developers to deep dive into a tiny detail of the battery usage. The biggest strength is an easy way to find out which background processes are invoked from your application and how often they are waking up the device. After making sure that your application works according to best practices for background thread management, the network connectivity should be your next focal point. Remember to always support Dark mode, to give your user not only a choice of colour palette, but also allow him to save his precious battery, because the last thing that you want is to have the user uninstalling your app, because you earned the top spot in the battery drainage ranking.


