From Migration to Innovation: AutoScout24's BI Modernisation Journey
Ece Kilkeser, Praveen Matthew and Archishman Roy · November 4, 2025 · 11 min read
TL;DR : We migrated from MicroStrategy to Amazon QuickSight, launched the QuickSight Guild, piloted “Talk to Your Data” with GenAI, and are now moving from migration to adoption, documentation and embedded analytics.
Table of contents
- A New Chapter in AutoScout24’s Data Story
- The World Before QuickSight
- Finding the Right Fit
- The Migration Journey
- The First Wins
- Building the QuickSight Guild
- Innovation Meets AI
- Lessons from the Journey
- What’s Next
- Closing Reflections
A New Chapter in AutoScout24’s Data Story
It all began with a question we kept asking ourselves: how can we make data more accessible, reliable, and impactful for everyone at AutoScout24?
Our data ecosystem had grown rapidly, powering thousands of decisions every month. But with growth came complexity—different tools, different standards, and a growing need for scalability. This is the story of how we took on the challenge to modernize our BI landscape, migrating from MicroStrategy to Amazon QuickSight, and how that journey reshaped our way of working.
The World Before QuickSight
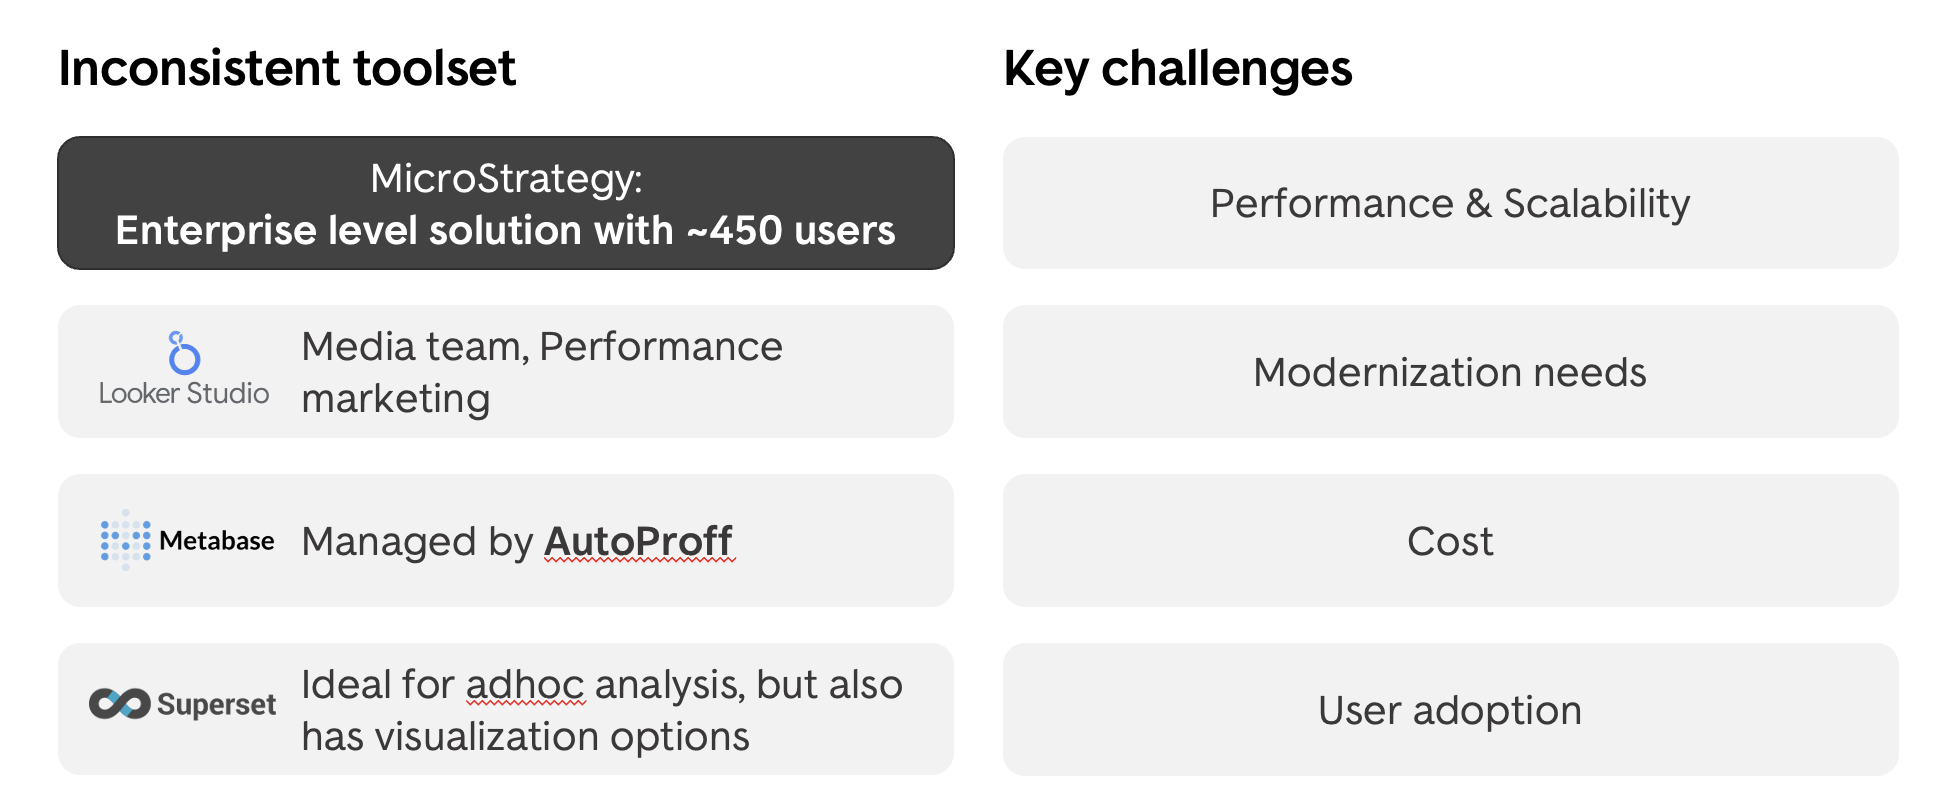
Before our migration, AutoScout24’s BI landscape was anything but simple. MicroStrategy had been our mainstay for years, supporting roughly 450 users across multiple teams. But it wasn’t our only tool — some teams used Looker Studio for GA data, Autoproff preferred Metabase, and others relied on Superset for visualisation. The result? A patchwork of tools, duplicated efforts, and inconsistent reporting.
On top of that, we were grappling with performance bottlenecks and outdated dashboard designs that no longer met modern usability expectations. Every attempt to enhance performance or improve design came with significant costs and heavy maintenance overhead. Unsurprisingly, user satisfaction had started to drop. It was clear that our BI ecosystem needed not just an upgrade—but a complete rethink.
At the same time, the rest of our data platform was already undergoing a major modernisation, moving toward a cloud-native, scalable, and well-governed architecture designed to support self-service analytics and faster innovation. Unfortunately, MicroStrategy struggled to keep pace with this evolution.
Unsurprisingly, user satisfaction had started to drop. It was clear that our BI ecosystem needed not just an upgrade but a complete rethink.
Finding the Right Fit
We began by listening—collecting feedback from stakeholders and power users to understand their challenges and expectations. Then came a series of proofs of concept with leading BI tools, testing real use cases across teams.
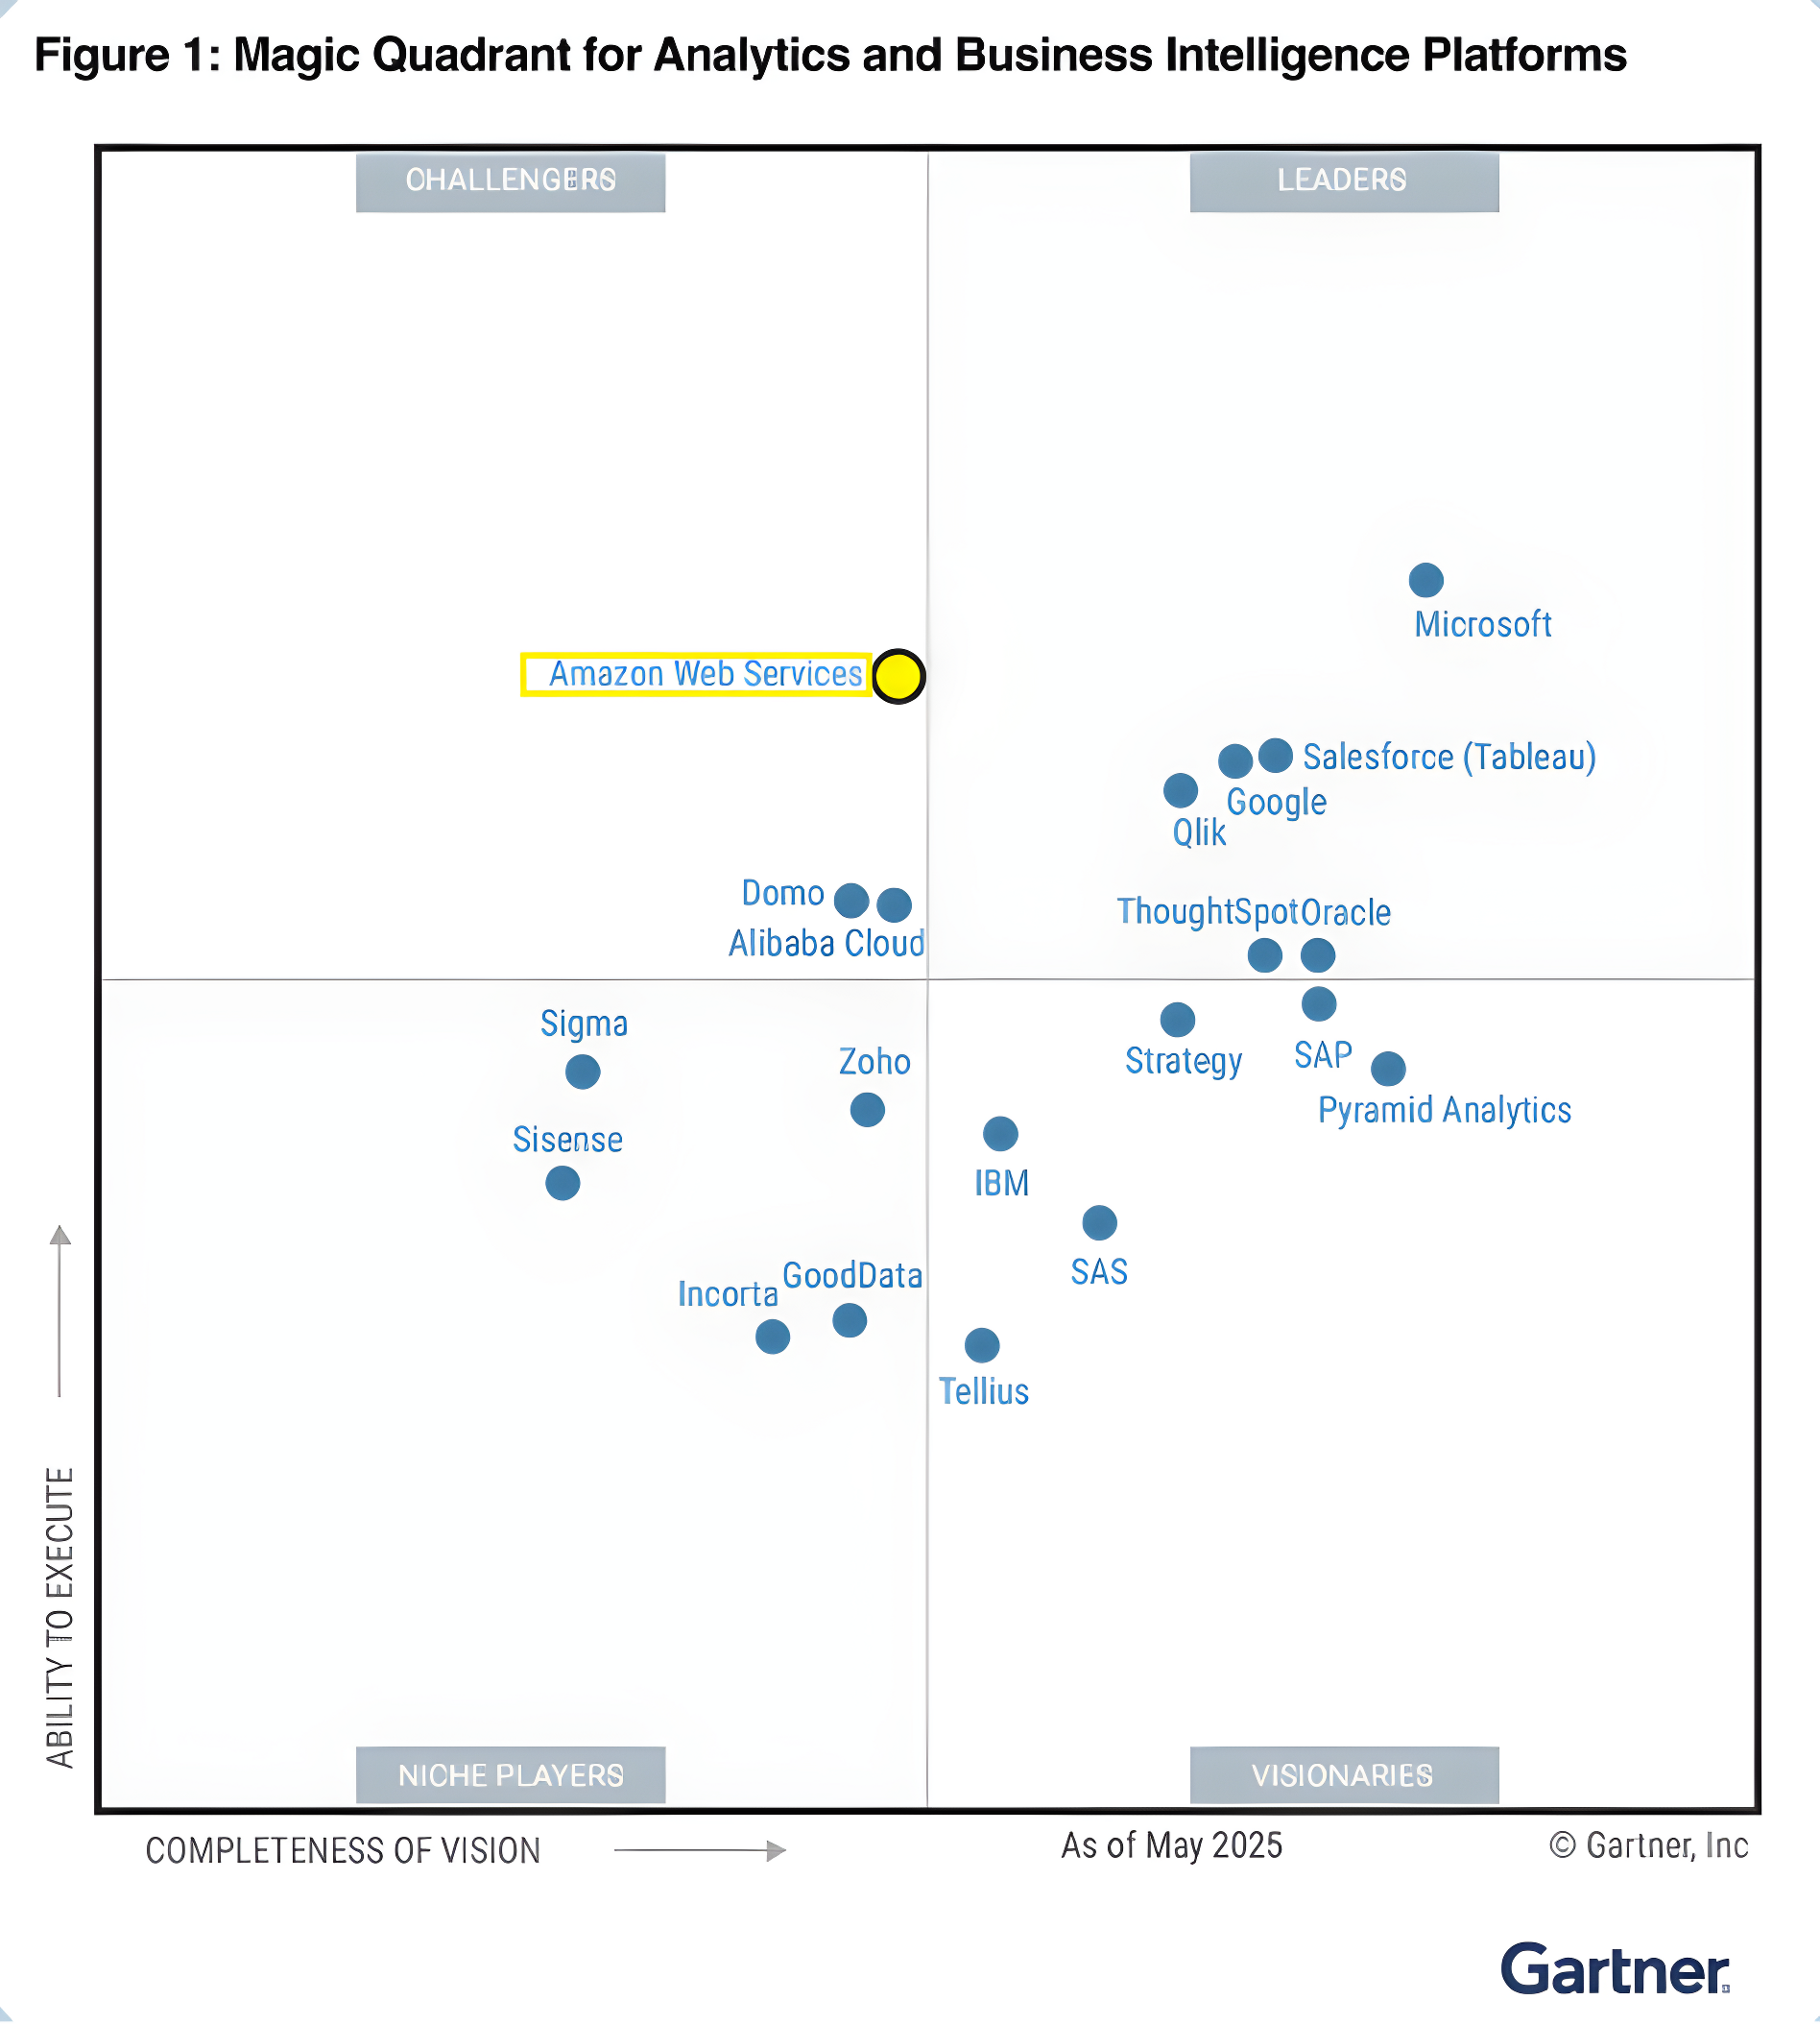
Each tool was evaluated across core dimensions such as technical compatibility, governance, self-service analytics, visualization, and advanced capabilities. After careful consideration, Amazon QuickSight emerged as the clear choice and Woodmark Consultancy was the right partner to support us along the way.
Four key factors drove our decision:
- Seamless integration with our AWS-based data platform
- Scalability & cost flexibility to grow without heavy licensing overhead
- Performance improvements reducing refresh times from hours to minutes
- Innovation, backed by AWS’s rapidly evolving BI roadmap
QuickSight wasn’t just a replacement—it was an enabler for a faster, smarter, and more connected BI ecosystem at AutoScout24.
The Migration Journey
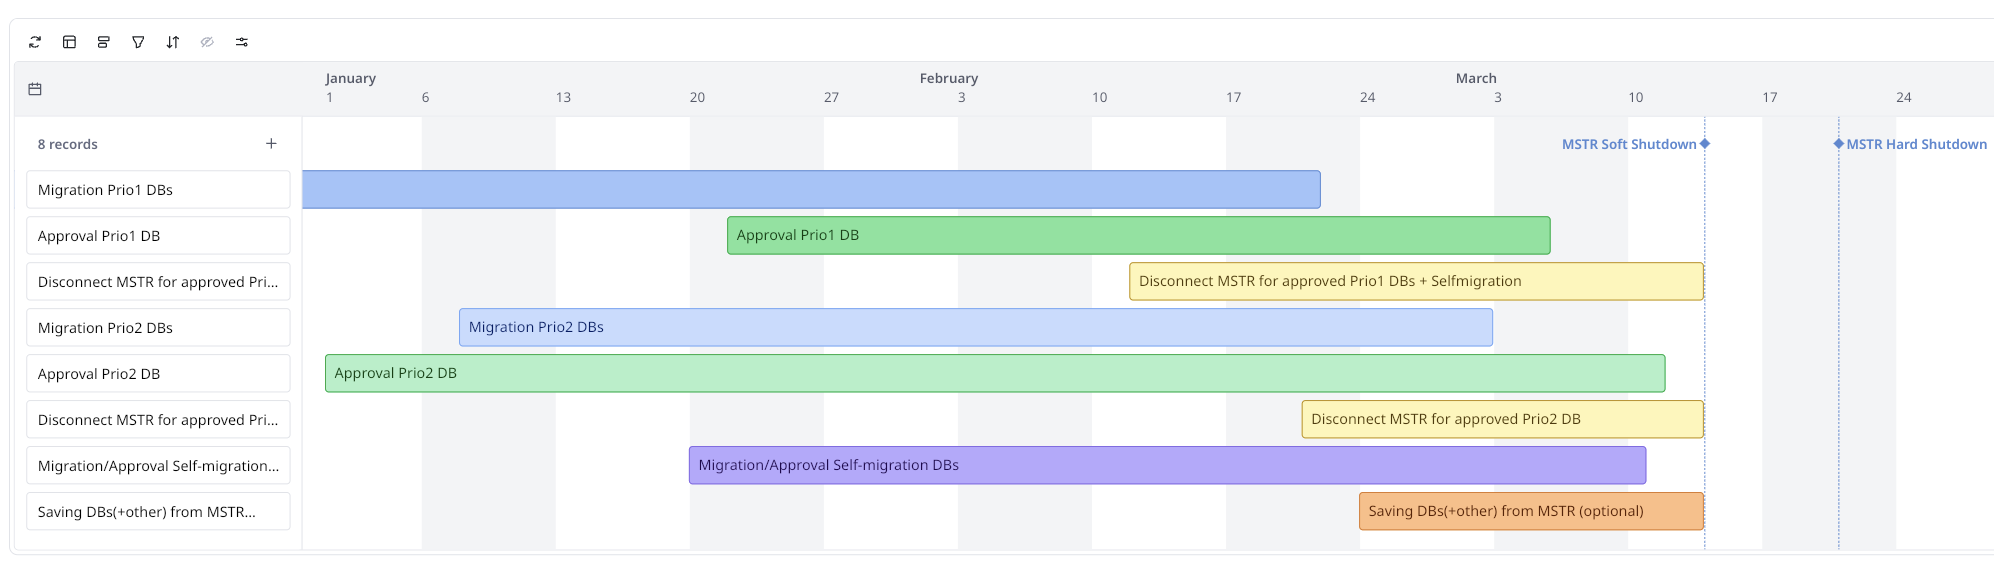
Our migration was executed between November 2024 and March 2025 in four well-structured phases designed to balance speed, governance, and quality.
1. Clean-Up & Audit
We began by cleaning up our BI environment, reducing 500+ dashboards to around 150 meaningful ones through usage analysis and stakeholder validation.
2. Prioritization & Effort Estimation
We worked with dashboard owners to rank the dashboards by priority and used a simple T-shirt sizing model to estimate migration effort. This helped us plan and execute efficiently.
3. Migration Execution
Dashboards were migrated mostly by Woodmark colleagues in iterative rounds, supported by weekly check-ins, status alignments. We encouraged open feedback loops and kept the process collaborative from day one.
4. Quality & Adoption
We introduced best practices, design templates, and performance optimizations, along with regular training / Q&A sessions / documentation at every level. The goal wasn’t just to migrate dashboards—it was to elevate our BI standards.
The First Wins
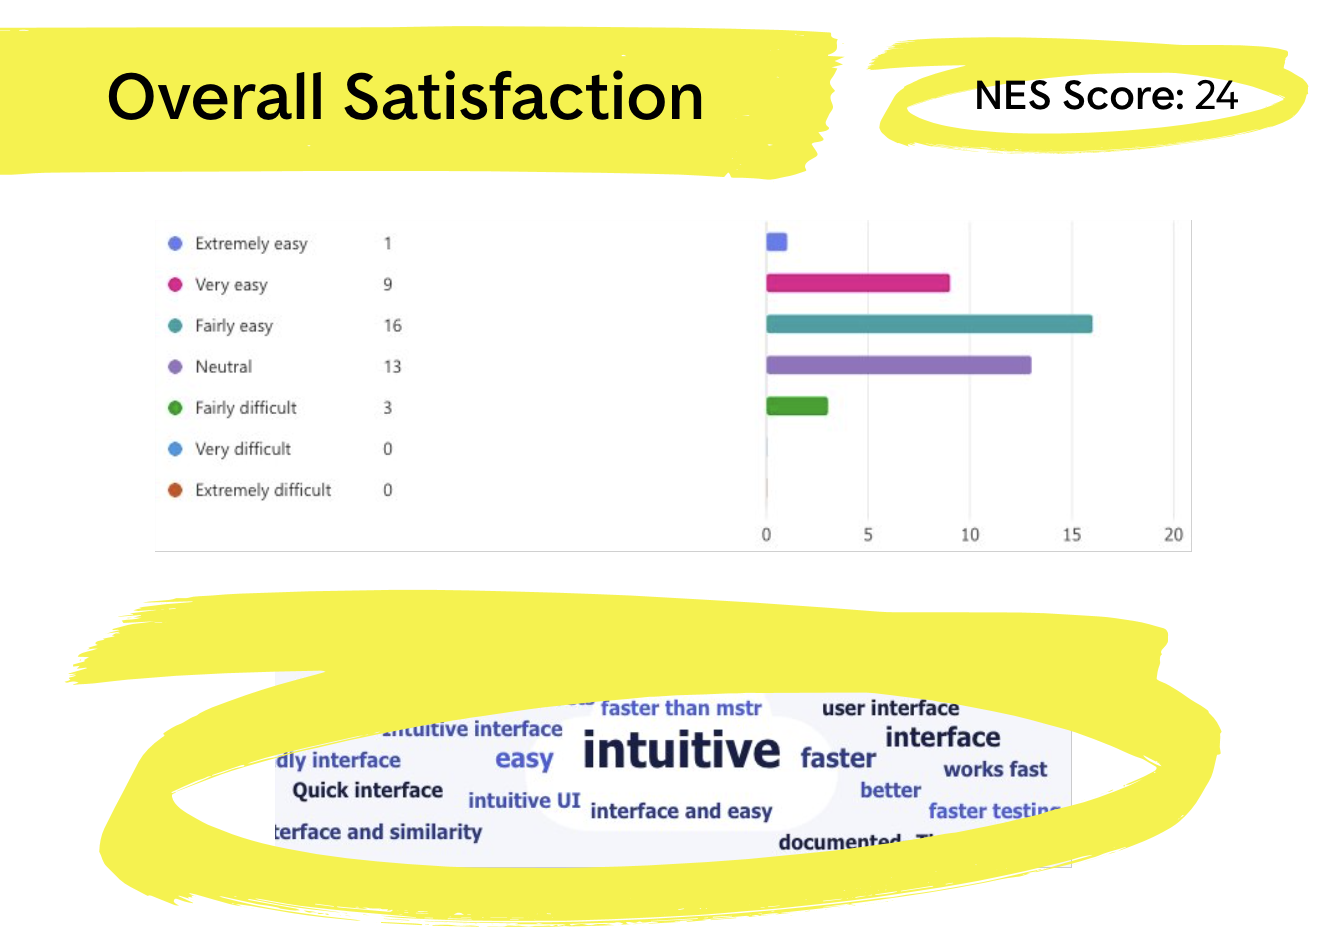
The impact was immediate and tangible. QuickSight’s modern UI and speed enhanced the experience. We finally had a system aligned with our data strategy—governed, performant, and intuitive. Adoption grew quickly as users discovered how much easier it was to explore and visualize their data.
Building the QuickSight Guild
Migration wasn’t just about technology; it was about culture.
To sustain momentum, we launched the QuickSight Guild - a collaborative space for analysts and data enthusiasts across teams to share learnings, solve challenges, and co-create new solutions.
The Guild quickly became the cornerstone of our BI culture. It enables us to:
- Build collective expertise in QuickSight
- Avoid bottlenecks by spreading ownership
- Encourage experimentation and innovation
Huge thanks to all the guild members. Your curiosity, collaboration and hard work made this transformation possible. Your work embodies our motto: “No more bottlenecks, only breakthroughs”
Innovation Meets AI
As the QuickSight Guild grew, it became a hub for experimentation and collaboration. Guild members came together to explore new features, test enhancements, and exchange insights.
AWS introduced Amazon Q, which evolved into QuickSight Q within the QuickSight ecosystem. This brought powerful new capabilities such as Q Topics, Dashboard Q&A, Stories, and Scenarios. With the rapid rise of Generative AI, the Guild focused on testing Q Topics and Dashboard Q&A—features designed to make dashboards conversational by combining contextual metadata with analyst-provided knowledge. Through extensive testing, the Guild identified several limitations in these GenAI features and provided detailed feedback and real-world use cases to AWS, helping shape future improvements.
As our QuickSight ecosystem continued to mature, we began to look beyond dashboards. The question evolved a lot from “how do we visualise data?” to “how do we interact with it?”
With AWS introducing QuickSight Q and Generative AI capabilities, a new opportunity emerged which was to make analytics conversational. Together with our partners at Woodmark Consulting, we kicked off an exploratory project called “Talk to Your Data.”
The goal was to create an intelligent BI assistant that enables anyone at AutoScout24 to “talk” to their data in plain language. Instead of searching through dashboards, users could simply ask questions like “How did RMS (Relative Market Share) trend in Germany last quarter?” or “Which market / country saw the highest dealer growth?” and get instant, reliable insights.
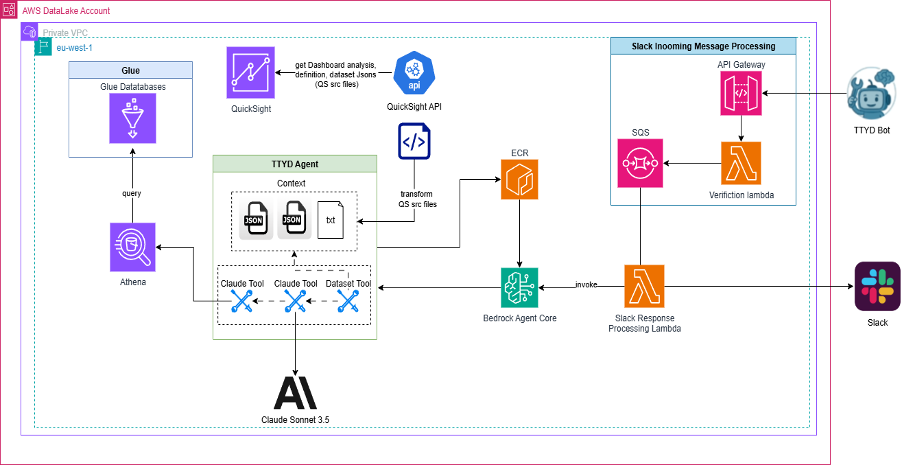
1. Data Source and Preparation
Glue holds metadata about data sources in Glue Databases. Athena queries the data stored in the data lake using the metadata from Glue.
2. QuickSight Integration QuickSight API retrieves dashboard definitions, analyses, and dataset JSON files. These files (QuickSight source files) are transformed and stored for further processing.
3. TTYD Agent (Talk To Your Data Agent) The agent has context from JSON and text files describing datasets and business logic. It uses Claude Sonnet 3.5 (a large language model) via Claude Tools and Dataset Tools to interpret user queries and generate insights.
4. Bedrock Agent Core Acts as the orchestration layer connecting the TTYD Agent and the external services. The transformed QuickSight files are stored in ECR (Elastic Container Registry) and integrated with Bedrock for execution.
5. Slack Integration:
- A TTYD Bot receives user questions in Slack
- The message goes through an API Gateway and Verification Lambda, which sends it to an SQS queue
- The Slack Response Processing Lambda invokes Bedrock Agent Core, retrieves the answer from Claude, and returns it back to Slack
End-to-End Flow
- A user asks a data-related question in Slack.
- The TTYD system fetches the relevant QuickSight and Athena data context.
- Claude generates the response, which is sent back to the user in Slack.
To test this concept, we provided Woodmark with two real QuickSight dashboards — the European PR Dashboard and the MVP Dashboard.
European PR Dashboard- This dashboard is designed for PR and media reporting. It features KPIs at the make and model level for all vehicle types, provides an overview of fuel types for cars, and includes EV search performance data.
MVP Dashboard - This dashboard monitors how the legacy AutoTrader.ca platform compares with the new One Marketplace during our European–Canadian integration and user migration. It focuses on traffic and funnel KPIs (traffic/session shift, step-to-step conversion rates, listing coverage and enquiry volume), with secondary engagement and consent metrics (session length, opt-in/opt-out, favourites, saved searches).
Therefore, the dashboards that were chosen were very different from each other, to eliminate any possible overfitting.
The prototype agent was trained on the metadata behind these dashboards: datasets, analyses, and column-level descriptions. We also enriched it with business context like definitions, KPI logic, and domain-specific knowledge that shaped how data is interpreted at AutoScout24.
This combination of structured data and human context allowed the agent to understand not only what the data contained but also what it meant.
Early results are promising!
The AI assistant could answer targeted questions with accuracy and context awareness, marking a first step towards Agentic BI, a new era where users no longer depend solely on dashboards but engage with data through conversation.
Another exciting part of the experiment was integrating the agent with Slack, one of our most widely used collaboration tools. The idea is simple yet powerful: let people ask data questions directly where conversations happen. The agent would capture a question from Slack, use the relevant QuickSight context and metadata to find the answer, and respond right within the same thread.
This opens the door to a truly frictionless experience — no switching tabs, no opening dashboards — just insights on demand, embedded in daily workflows.
Lessons from the Journey
Looking back, we’ve realised that true transformation goes far beyond tools and technology — it’s about people, culture, and mindset.
Here are some of our key takeaways from AutoScout24’s BI modernisation journey:
1. Involve users early and often. From the first proof of concept to the final migration, continuous feedback was our most valuable compass. Involving business users not only improved adoption but also built trust in the new system.
2. Governance and agility can coexist. A well-structured governance framework doesn’t slow innovation — it accelerates it when designed thoughtfully. QuickSight’s integration with our data platform allowed us to combine compliance with flexibility.
3. Think iterative, not massive. By migrating and improving dashboards in small, manageable waves, we ensured higher quality and faster learnings. Each iteration made the next smoother and smarter.
4. Community is the real catalyst. The QuickSight Guild is becoming more than just a forum. It should become a culture. A space where data enthusiasts collaborate, experiment, and share knowledge freely. It reminds us that the best BI systems are built by communities, not just teams.
Ultimately, this journey isn’t just about replacing a BI tool, it is about reimagining how we work with data. From migration to modernisation, and now to AI-driven innovation, AutoScout24’s BI evolution continues, guided by curiosity, collaboration, and a shared belief that better data means better decisions for everyone.
What’s Next
As we close the chapter on migration, our next phase is all about adoption, standardization, and expansion. We’ve built the foundation for a modern BI ecosystem—now it’s time to help it scale and evolve with the organization.
1. Driving Adoption with QuickSuite. With the recent rollout of the QuickSuite, our goal is to make insights accessible for every role at AutoScout24. Over the next months, we’ll focus on increasing internal adoption of these new capabilities, empowering teams to self-serve faster and with more confidence. By simplifying discovery and automating recurring insights, we expect to reduce ad-hoc data requests by up to 50%, freeing analysts to focus on higher-impact work such as optimization and experimentation.
2. Standardizing Dashboard Documentation
We will introduce a standardized dashboard documentation process to make every dashboard easier to understand and maintain.
Each dashboard will include clear ownership, purpose, and data definitions, directly linked to our Data Portal and CDM products. (Data Portal is our internal dataset catalogue and governance UI; CDM is our Consumer Data Model.) This will help teams find dashboards faster and ensure everyone speaks the same data language.
3. Expanding to Embedded Analytics As AutoScout24 expands its footprint across the Atlantic through the acquisition of Trader Corporation, our analytics use cases are evolving. We’re now preparing to enable external-facing dashboards for our ecosystem partners—from car dealers and lenders to software providers.
This marks the beginning of our Embedded Analytics journey, where QuickSight’s capabilities will extend beyond internal users to deliver value directly to our partners.
Starting next year, we aim to roll out this capability with advanced access controls, personalized views, and secure data-sharing mechanisms, making insights an integrated part of every digital interaction.
The journey doesn’t end with migration, it evolves with innovation.
Closing Reflections
At AutoScout24, we’ve learned that real transformation happens when technology and people evolve together. Our BI modernisation wasn’t just about migrating tools—it was about preparing our teams for the future of analytics, one where GenAI becomes a trusted companion rather than a challenge to overcome.
We recognised early that resisting AI is a losing strategy. The organizations that treat it as an ally—one that amplifies human creativity and accelerates decision-making—will be the ones leading tomorrow. For us, that means embracing GenAI to simplify how people interact with data, reduce manual effort, and unlock new ways of thinking.
Our journey continues with this mindset: innovation through collaboration with technology.
Our mission remains unchanged—to make data effortless to access, trusted to use, and impactful in every decision at AutoScout24.