
Android macrobenchmark
Vadim Shchenev · March 4, 2024 · 6 min read
At Autoscout24, we are a team of passionate android developers who always keep up with the latest technological innovations and update our application accordingly. We stay informed about the new trends in the industry by reading articles and attending conferences. We also contribute to the development community by publishing articles that share our knowledge and best practices. Recently, we visited the Droidcon Berlin conference, where we gained many insights and ideas for our technical initiatives roadmap.
Today, we are excited to share with you one of our topics: measuring application startup time. This is a valuable and ongoing practice that helps us avoid application lags and enhance user experience.
Thanks to this great presentation, we started to integrate this cool feature into our builds delivering process.
Macro benchmark tests
Following the official guideline we can easily add the macro benchmark module into the project. The Android Studio tools can help integrate it into existing projects and modify your build scripts.
We will skip the full detailed instruction (please take a look at the official one), but at least we can define the major steps. First, create a macro benchmark module and make sure that your benchmark build type is debuggable.
And if your project is big and complicated and contains more than one build flavour and build type you might need to add matching fallbacks configuration and flavour dimensions. For example
buildTypes {
   benchmark {
       debuggable = true
       signingConfig = debug.signingConfig
       matchingFallbacks = ["release"]
   }
}
and
flavorDimensions += ["company"]
productFlavors {
   flavour1 { dimension = "company" }
   flavour2 { dimension = "company" }
}
It should be enough for most cases and now we can write our first test.
For our project we added some simple tests for Warm, Hot and Cold start up time measurements. Let’s take a look at this example:
private const val TARGET_PACKAGE = "com.yourproject"
private const val ITERATIONS = 5

@Test
fun coldStartUp() =
   benchmarkRule.measureRepeated(
       packageName = TARGET_PACKAGE,
       metrics = listOf(StartupTimingMetric()),
       iterations = ITERATIONS,
       startupMode = StartupMode.COLD
   ) {
       pressHome()
       startActivityAndWait()
   }
It is a simple example and it collects the cold startUp time measurements. It is important to understand that we can not expect absolutely the same value for every test. And moreover this test in comparison with regular instrumentation tests should not be failing. There is no failed state, but there are some metrics that we can use to define the “failing” state by ourselves. As a result of its execution we can see a JSON file with benchmark test results data (it can be found in the benchmark/build folder):
{
   "name": "coldStartUp",
   "params": {},
   "className": "com.yourproject.benchmark.AppStartupBenchmark",
   "totalRunTimeNs": 29252635722,
   "metrics": {
       "timeToInitialDisplayMs": {
           "minimum": 1159.760792,
           "maximum": 1227.281959,
           "median": 1188.830917,
           "runs": [
               …
           ]
       }
   }
}
As we can see from this example after 5 runs we do not have the same time for every run. By adding these tests to CI/CD we should always keep it in mind while monitoring the trend of changes.
Congratulations! We are done with our first test.
CI/CD and Dashboard
Of course it is the most interesting part and we have some options here. First we need a place to run those tests. We are using Firebase Test Lab to run UI tests and it is suitable for benchmark tests as well. It works great and if you already have it, you can say that you are 30% done. But what else should be done? It is important to define your team’s goals for these measurements. If you want to monitor every PR and you already use the GitHub actions, please follow this guideline. It is very descriptive and will walk you through all the steps.
We have a practice that works well for us: we have UI tests, but we don’t run them for every PR to save time. We run them in the nightly build instead. If the build passes, we have a release candidate ready by the morning. If it fails (which is very rare, by the way - it happens maybe once a month for the 4+ mobile teams), our developer on call (we call them sheriff) has to find and notify the team responsible. This way, we avoid delays with releases. Based on this experience, we decided to include benchmark tests in the nightly build as well.
So now we have the following plan:
- Run UI tests
- Run benchmark tests
- Generate the release candidate and upload it into our distribution channel.
Let’s take a look now, which options do we have? Of course as we can follow the official guideline we can create our own Google Cloud dashboard that we can use for monitoring and add some alerts (that we can define). And moreover we can transfer our metric values into any other services that we can use for monitoring. For example in our company we use the DataDog not only for backend services, but also for mobile apps as well. We have a sheriff who should pay attention to it daily. As we already have a well done dashboard in DataDog we decided to simplify this story to collect the benchmark results there. Let’s take a closer look and maybe define our steps on how we can do it.
First, we should run our benchmark tests in the Firebase test lab. We use Jenkins as our CI/CD machine and we easily can add the following command to do it:
gradle "assembleYourAppBenchmark"and
gcloud firebase test android run \
   --type instrumentation \
   --app "${root_directory}/app/build/outputs/apk/your-app/benchmark/your-app-benchmark.apk" \
   --test "${root_directory}/benchmark/build/outputs/apk/your-app/benchmark/benchmark-your-app-benchmark.apk" \
   --device model=redfin,version=30,locale=en,orientation=portrait \
   --directories-to-pull /sdcard/Download \
   --results-bucket gs://your-macrobenchmark-results \
   --environment-variables additionalTestOutputDir=/sdcard/Download,no-isolated-storage=true \
   --timeout 20m
Please make sure that you have gcloud tool installed on your CI/CD machine. These commands generate a build for tests and upload it into the Firebase test lab. Then after tests, test results will be saved into a special bucket (please take a look at this guideline to know how to create your bucket).
When execution is done we have at least two options here. We can hand these results by cloud functions or we can fetch this data manually.
By running the following command we will have an array of folders stored in the bucket (please do not forget to set up the bucket’s lifecycle policy to clean up your bucket periodically).
gsutil ls gs://your-macrobenchmark-results/Then we can select a folder and see our JSON output file like
${folder}/redfin-30-en-portrait/artifacts/sdcard/Download/com.yourproject.benchmark-benchmarkData.jsonThen we can download it
gsutil cp "$remote_test_results_path" "$report_path"and parse the data in any comfortable way for us (maybe create a script or a small jar application to do it).
And the last step, we can send this data to our remote data storage.
Conclusion
As this job is done, we can keep our eyes on the important performance metrics. Nobody wants to see the application lags and wait a long time before the content will be shown. As we already mentioned, our sheriff pays attention to it daily and we know the trend of changes. Just look at that beautiful diagram:
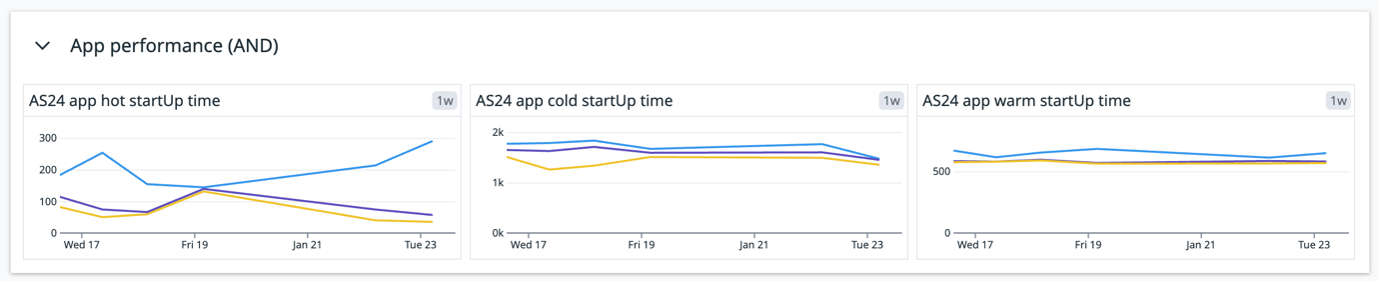
The diagram shows the startup time in milliseconds, with the maximum (blue), minimum (yellow), and median (purple) values. By monitoring this metric, we can ensure optimal performance and responsiveness. The quality of our application depends on our efforts. Let’s deliver the best user experience and app performance possible!